The charting method transforms chaotic and dense data into clear, easily navigable charts, making study sessions and data analysis more efficient and less overwhelming.
It’s especially ideal for those who learn visually or prefer detailed notes, which makes it an awesome tool for bringing order and clarity to your ideas.
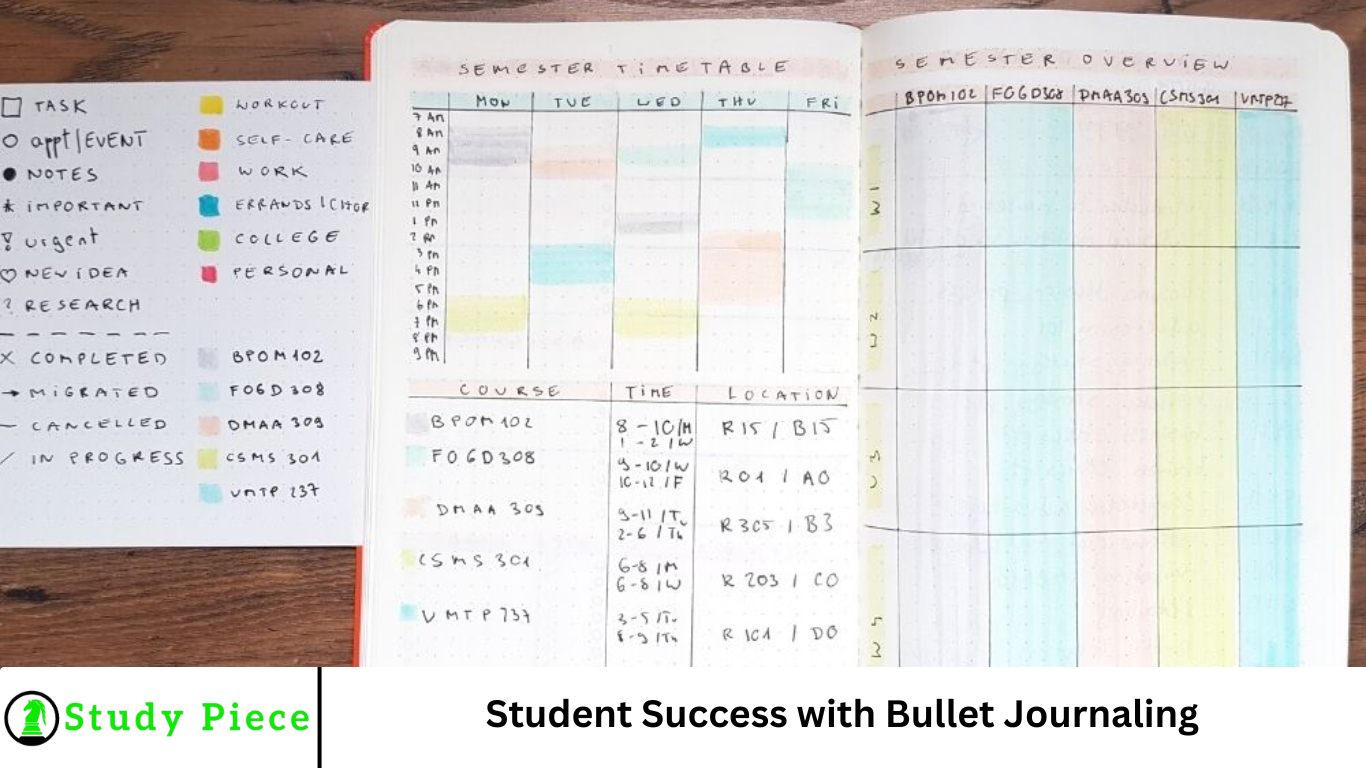
More Read: 8 Best Apps for Taking Notes in School or College
Charting Method 101
- The charting method excels in organizing complex information and categorizing data into a structured, tabular format.
- It helps in analyzing and comparing various aspects of information, making it ideal for subjects requiring in-depth analysis.
- Streamlines the note-taking process, particularly for data-heavy content.
- The clear layout of charts allows for easy and quick retrieval of information.
Charting Method: Definition
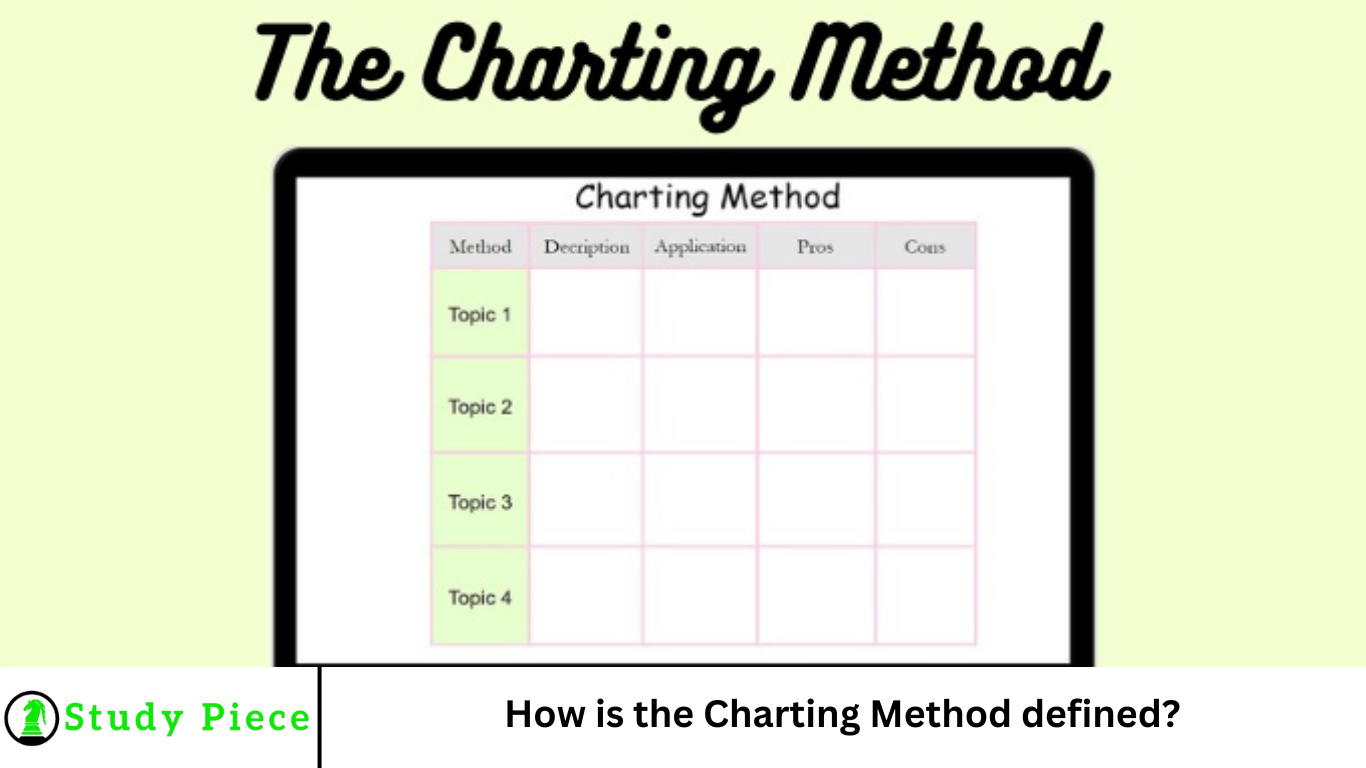
The charting method in note-taking is a strategic approach that involves organizing information into a tabular format or chart.
This method is particularly effective for capturing and categorizing complex data, making it easier to analyze and review. It also reduces the amount of writing necessary.
At its core, the charting method entails creating columns and rows in which different categories of information are systematically placed.
- Structured Categorization: Information is divided into categories or topics, each assigned to a specific column. This creates a clear visual separation of ideas and concepts, allowing for quick comparison and contrast across different categories.
- Efficient Data Synthesis: Rows are used to list subtopics or specific details under each category. This layout aids in synthesizing information and spotting relationships or patterns across various subjects or themes.
- Adaptability to Content: The charting method is highly adaptable and can be tailored to suit the noted content. Whether it’s for academic lectures, business meetings, or personal study, the format can be adjusted to capture the essential information effectively.
The charting method is valuable for note-takers who deal with content requiring categorization and direct comparison. It offers a clear, structured way to organize notes effectively, making it an ideal choice for subjects that involve comparative analysis or data-driven topics.
How Does the Charting Method Work?
Creating a chart for note-taking using the charting method involves a few structured steps:
- Determine the Main Categories: Start by identifying the main categories or topics that you want to cover in your chart. These will form the headings of your columns.
- Set Up Your Chart: Draw a table in your notebook or create a digital one. Label each column with one of your main categories.
- Identify Subtopics or Details: As you listen to a lecture or read material, note down key points or subtopics under their corresponding categories in the rows of your chart.
- Fill in the Details: Add specific details, data, or information under each subtopic across the relevant categories. Be concise to keep the chart format clear and easy to read.
- Review and Update: Regularly review your chart to fill in any gaps or add additional information as needed. This will ensure that your chart remains comprehensive and up-to-date.
The visual layout of the chart is particularly beneficial for those who prefer a more graphical representation of data, aiding in better comprehension and retention of the material.
The charting method emphasizes organization and is a powerful tool for managing complex information in a manageable and accessible format.
Benefits of the Charting Method
The charting method offers several advantages for note-taking, particularly in organizing and processing information:
- Enhanced Data Organization: This allows for systematic categorization of information, making it easier to manage and navigate complex data.
- Improved Study Efficiency: By organizing notes into charts, this method simplifies the revision process, making studying more efficient and less time-consuming.
- Visual Clarity: The clear structure and layout of charts help in visualizing relationships between different sets of data.
- Facilitates Comparative Analysis: Ideal for subjects or topics that require comparison and contrast, as it visually aligns different variables side by side for easy analysis.
- Adaptability to Various Subjects: It is flexible enough to be used across a wide range of subjects, from history to business and economics, adapting to the specific needs of the content.
- Aids in Pattern Recognition: The organized format helps identify categories, trends, and correlations within the data, which is beneficial in analytical studies.
With its organized approach and visual clarity, the charting method offers a practical solution for dealing with intricate and data-heavy content, making it a valuable technique for students, professionals, and anyone looking to enhance their note-taking skills.
The Charting Method vs Other Note-Taking Techniques
The charting method is an organized approach to categorizing and comparing information, primarily using tables and charts.
In contrast, outlining or narrative techniques rely on linear text progression and bullet points.
The charting method is ideal for scenarios requiring data comparison and trend analysis, while other techniques may be better suited for sequential or conceptual information.
Overall, the charting note-taking method offers a more analytical and comparative perspective on note-taking.
Frequently Asked Question
What is the Charting Method?
The Charting Method is a systematic note-taking technique that organizes information into columns and rows, helping learners compare and contrast data efficiently.
How does the Charting Method work?
It involves creating a table with headings based on categories or topics, then filling in key details under each column as information is presented.
What are the main benefits of using the Charting Method?
This method enhances clarity, helps identify patterns and relationships, and is particularly useful for subjects with a lot of factual comparisons.
When is the Charting Method most effective?
It’s best used when dealing with information that can be grouped into categories, such as historical events, scientific data, or medical case studies.
Who can benefit from using the Charting Method?
Students, professionals, and researchers—especially in fields like medicine, law, and business—can benefit from its organized approach.
What tools or materials are needed for the Charting Method?
You can use a notebook, spreadsheet, or digital tools like Excel or note-taking apps that support tables.
Are there any limitations to the Charting Method?
Yes. It may not be ideal for narrative-heavy content or subjects that require detailed explanations over data comparison.
Conclusion
The Charting Method is a powerful note-taking strategy designed to organize complex information into a clear, structured format. By breaking down data into rows and columns, it allows for easy comparison, pattern recognition, and quick reference—making it especially valuable in academic, professional, and research settings. While it excels in organizing categorical information, it’s most effective when applied to content suited for structured analysis rather than narrative detail. With the right context and tools, the Charting Method can significantly improve comprehension, retention, and productivity.